February 15, 2023

Source: Bigstock
Since May 25, 2020, America has crucified itself over a single statistic: Blacks are two to three times more likely to die at the hands of the police than are whites, making up 25 to 35 percent of police killings.
In contrast, other data points that could add nuance to the conversation are considered by the prestige press to be extremely inappropriate to mention.
For example, the most careful estimate yet of what percentage of murders in America blacks committed in 2021 comes up with a best guess of 64 percent of all cases, cleared and uncleared. This suggests that blacks are recently an order of magnitude more homicidal than the entire rest of the population (including Hispanics).
This is an astonishing ratio. Without being aware of it, it’s practically impossible to think intelligently about many of the most pressing public issues of the 2020s.
My impression is that most Americans are only aware of this datum in their private lives but not when it comes to public debate. Only the growing ranks of the consciously anti-woke (the type of ornery individual who responds to the usual clueless mainstream media articles with quantitative comments citing government crime statistics) understand the magnitude and importance of this statistic.
I’ve noticed that when true believers in the conventional wisdom are confronted with the official numbers, they often respond with arguments that clearly haven’t been battle-tested.
For example, a common rejoinder is that blacks have higher homicide rates only because the police are keeping an eye on them more closely. This might sound plausible for, say, jaywalking tickets, but it makes no sense to postulate that tens of thousands of additional whites must be getting murdered each year by other whites without anybody noticing or talking about it. In reality, unsolved murders of young white women tend to become national obsessions.
Other retorts focus on moral culpability: e.g., blacks shouldn’t be blamed for committing more murders because of the lingering effects of 1619, Jim Crow, and/or New Deal redlining.
First, whether or not blacks have a good excuse for their murder rate is irrelevant to the fact that their murder rate is what it is. We could have avoided public policy disasters like the current boom in homicides and traffic fatalities during the “racial reckoning” if we hadn’t been so willfully ignorant of this fundamental fact of American life.
Second, it’s hard to see how putative causes in the increasingly distant past, such as the white murder of black Emmett Till 68 years ago, can explain why black shootings and car crashes exploded immediately after George Floyd.
Third, the most scientific-sounding excuse is that blacks commit more killings because they were raised in lower-income households (which can in turn be blamed on slavery or whatever).
After all, it is true that the poor do shoot each other more than the rich do, and blacks are, indeed, less well-paid than are whites.
So, do differences in income explain all of the black-white gap in serious crime?
No.
The conclusive data was assembled by the remarkably industrious Harvard economist Raj Chetty in his 2019 paper “Race and Economic Opportunity in the United States: An Intergenerational Perspective.”
Chetty has strenuously positioned himself as an anti-racist good guy, so the fact that his data has repeatedly vindicated bad guy Steve Sailer’s perceptions has yet to register on the less bright members of the media (e.g., not Matt Yglesias).
Over a decade ago, Chetty set out to find where in America was the Magic Dirt upon which poor kids most often rose to the middle class. And where was the Tragic Dirt that condemned them to another generation of poverty? Then, all we’d have to do is learn the lessons of what they are doing right in the good places and doing wrong in the bad places.
But when Chetty published his first map of high and low social mobility in The New York Times in 2013, I immediately pointed out that his findings of regions with strong upward mobility were simply white places, like the upper Great Plains and Utah. And his low upward mobility spots were black regions like the Cotton Belt or American Indian reservations. This is because blacks and Native Americans regress toward lower mean incomes than whites.
Ever since, I’ve probably developed more insights from Chetty’s data than he has. The Indian-born savant is not a particularly acute analyst of this country. But he is a prodigious compiler of data that previously had been thought off-limits due to privacy rights.
Chetty’s methodological brainstorm was to forge relationships with federal agencies like the Internal Revenue Service and the Census Bureau so that they would provide him with individual data, such as your tax returns, but in “anonymized” form.
So far, I haven’t heard of any scandals about leaks of personal information from Chetty’s operation, so the feds appear right to have trusted him.
Chetty then linked information from different bureaus using an anonymized version of your Social Security number, so he knows what your income is from your 1040 and what your race is from your Census form. He knows who your kids are from whom you claimed as a dependent in the 1990s, what college they went to, if they were involuntary guests of correctional facilities on the day of the 2010 Census, and how much income they earned up through 2015.
He’s built a database of 21 million Americans born between 1978 and 1983. He knows their parents’ incomes for 1994–2000 (when the kids were between 11 and 22 years old), if they were in jail on April 1, 2010, when they were about 30, and how much income they reported in 2014–2015 when they were in their mid-30s.
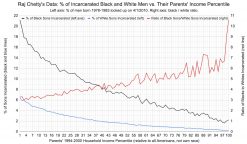
Here’s my graph of Chetty’s crucial findings:

If you don’t believe my graph, The New York Times published a fairly similar graph of the same data in 2018, and Chetty created his own graph. My graph is more self-evident, but it’s the same shape as the other two.
By the way, I don’t know why Chetty didn’t make available to the public the Hispanic imprisonment rate. Perhaps framing his data solely as black vs. white makes more plausible-sounding racist, antiwhite interpretations such as the NYT’s hilarious headline on Chetty’s findings: “Extensive Data Shows Punishing Reach of Racism for Black Boys.”
The fact that Hispanics have improved their relative law-abidingness while blacks have not is an unwelcome distraction for Chetty’s career prospects.
The horizontal axis represents their parents’ income in 1994 to 2000 by percentile of the entire population. Each single percentile represents 213,000 Americans born around 1980.
In case you are wondering, Chetty is using the same income scale for both blacks and whites. Thus, in the highest percentile, the “One Percent” of Occupy Wall Street demonology, there are 186,600 whites and only 1,800 blacks.
The left vertical axis is the percentage of the parents’ sons who were incarcerated on April 1, 2010, when they were 26 to 32 years old. Among black men (black line) raised in the lowest percentile of parental household income, over 21 percent were locked up vs. over 6 percent of white men (blue line) raised in the same extreme poverty.
For both races, incarceration rates fall steadily with increasing affluence of upbringing. Among whites, only 0.2 percent of sons of the One Percent were in the slammer. Among blacks, the lowest percentage (1.6 percent) is found in the 98th percentile, before the incarceration rate rises in the two highest-income percentiles.
This curious anomaly could just be due to statistical noise. In the top two percentiles of upbringing reckoned across all races, there were only about 2,100 youngish black men altogether and roughly 45 of them were under lock and key.
Or it could be that this third-highest percentile is the most bourgeois among blacks, featuring, say, partners in law and CPA firms, while the top two percentiles are more loaded with black jocks and entertainers, whose sons tend to be more of a handful.
With that minor exception, why do richer kids wind up in jail less often? There are no doubt numerous reasons of nurture and nature, ranging from the wealthy being able to afford better defense attorneys, to neighborhoods without youth gangs to ensnare your son into a life of crime being more expensive, and on to genetics. In general, being wealthy is good, and you should strive for it for the sake of your kids.
The right vertical axis denotes the ratio (red line) of the black percentage incarcerated divided by the white. Unexpectedly, it rises steadily with childhood affluence.
Among men raised in the dirt-poor first percentile, blacks are 3.3 times as likely to be imprisoned.
At the 25th percentile, blacks are confined 3.9 times as often.
At the 50th percentile, the ratio is 4.5 to one and at the 75th percentile it’s 5.0.
At the 98th percentile, the ratio is 6.7, before exploding to 10.7 at the 100th.
The median black household income falls around the 27th to 28th percentile nationally, where black men are locked up 4.0 times as often as white men. So that’s probably the best summary statistic: All else being equal in terms of household income during adolescence, black men are four times as likely to find themselves behind bars as white men.
That’s a huge disparity.
For instance, black men at the 98th percentile of upbringing, the best-behaved black cohort, are jailed as often as white men at the 50th percentile. Similarly, the black rate at the national median of income is 7.2 percent, a little higher than the white rate at the single lowest percentile.
That suggests that there is approximately a two standard deviation difference in racial propensity to be prison-bound even when controlling for affluence when young.
In the social sciences, a one standard deviation difference, such as in IQ, is very large. Two is almost unheard of. Two standard deviations after adjusting for childhood income is off the charts.
Why does the black-to-white ratio get steadily worse with higher income?
I don’t know. Before seeing Chetty’s data, I might have guessed it shrank.
Is the cause racism?
Well, if it is, racism doesn’t much hinder black women. They appear to be incarcerated only about 30 percent more often than white women raised with the same family income, not 300 percent more often as with black men.
In general, racism provides a boring and obtuse all-purpose faith-based rationalization for everything otherwise interesting about American life. But can racism create a rock too heavy to lift off the backs of African-Americans?
More interestingly, I’ve been arguing since the 1990s that blacks average more masculinity than other races. This has its upsides where maleness is a plus, such as blacks playing more on Super Bowl-winning teams. But it also has its downsides, such as blacks committing more felonies.
Every culture has to deal with the inevitable problems caused by rampant masculinity. For example, Europe spent over a thousand years nagging and cajoling its hereditary warlords into behaving a little more like Christian gentlemen.
What has never worked is giving up the struggle, as American culture has more or less done in this decade. Lately, we’ve declared that all empirical evidence of bad behavior by blacks must be proof of white malevolence.
Not surprisingly, this cultural collapse is inducing blacks to behave even worse.